
The NodeTool desktop app is built on Electron. It reuses the web app for all workflow editing but adds a handful of native surfaces: a boot splash, package manager, log viewer, tray menu, pinned windows, and a native menu bar.
This page catalogs every desktop-only view with screenshots. Everything inside the main window is covered by User Interface and Workflow Editor.
Boot Message (Splash)
A splash appears in the main window while the backend and web app come online.
It shows the NodeTool logo and the latest boot message from the backend, for example “Setting up Python runtime (one-time, ~1-2 min)…”, “Installing Nodetool Python packages…”, or “Updating 2 package(s)…”. During setup it also shows a progress bar and a carousel of supported providers with a Get API Key link for each. A Show Log toggle expands the live startup log, and a folder button opens the raw log file.
If the backend fails to start, the splash shows “Backend failed to start” with the error and three buttons: Retry start, Open logs, and Reinstall environment.
There is no separate install wizard. Python is an optional runtime. You install it from the Runtimes panel of the Package Manager, and it is also installed automatically the first time you install a Python package there. Node packs and runtimes are managed from the Package Manager.
Package Manager
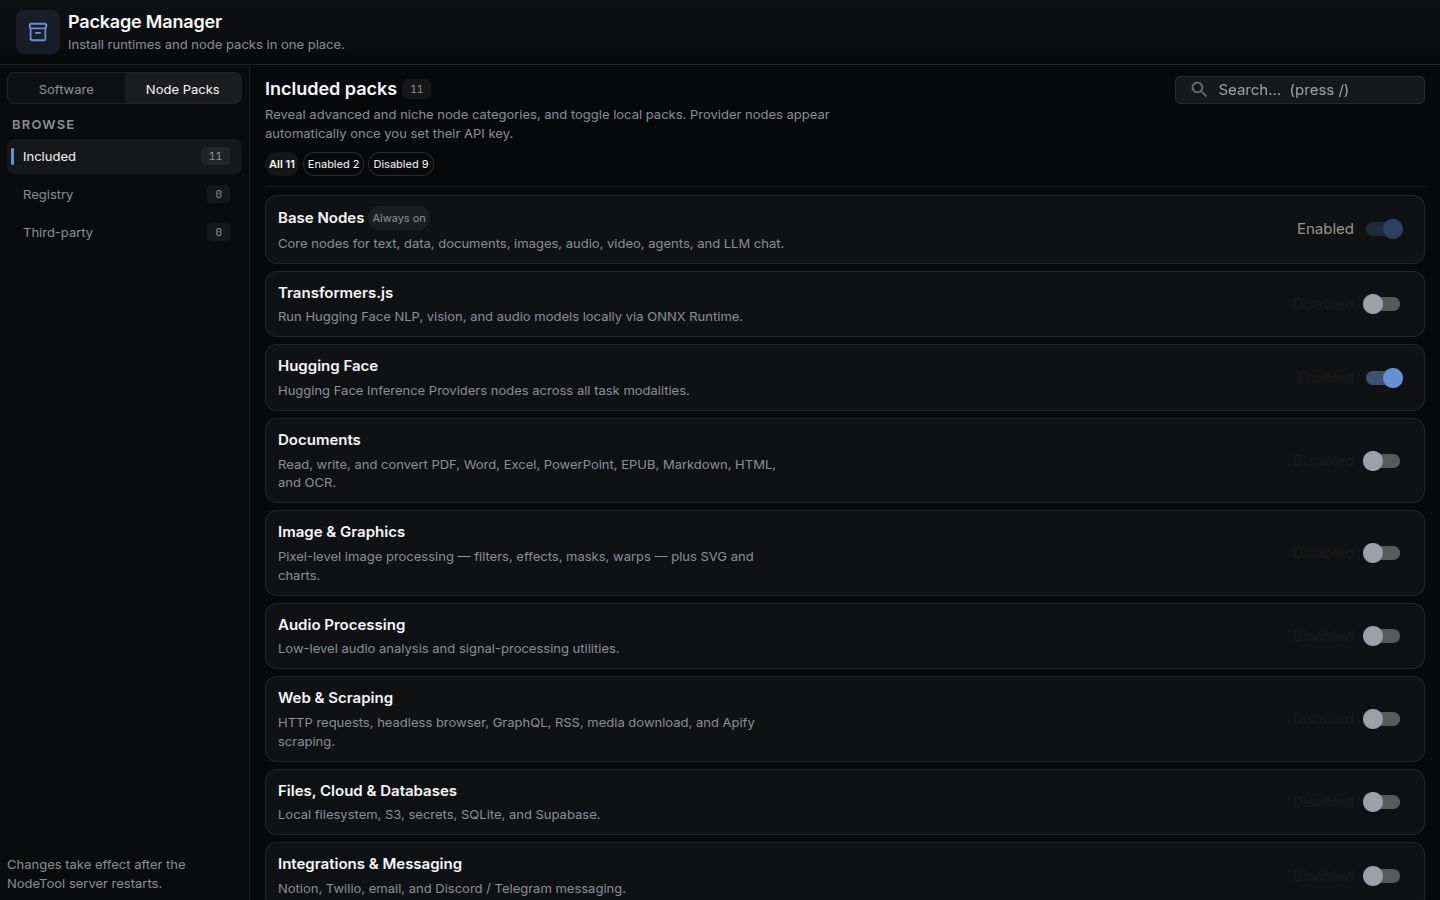
The Package Manager is a page inside the main window, not a native window. Open it from Tools → Package Manager in the menu bar or from the logo menu (Package Manager, which shows only when the app is served from localhost). It opens as a workspace tab on the /packages route.
The left rail switches between two tabs:
- Software: system runtimes, grouped as All runtimes, Languages, Media & docs, and AI runtimes.
- Node Packs: grouped as Included, Registry, and Third-party.
Each list is searchable (press /) and has status filters such as Installed, Not installed, Updates, Enabled, and Disabled. The page remembers the last tab and category.
When a registry pack has a newer version, a notice reading “New Nodetool packs available” appears at the bottom right with the installed and latest versions. The notice points to the Package Manager for updating.
See Node Packs for where packs come from and how to publish your own.
Log Viewer
A separate window (1200×800) that shows the backend log. Open it from Tools → Log Viewer or the tray.
Each row is color-coded as info, warning, or error. The toolbar has a Search logs… box, a level filter (All, Info, Warning, Error), an auto-scroll toggle, Copy for the filtered rows, and Clear. Click a row to select it, Shift+click for a range, Ctrl/⌘+click to toggle. Selected rows are copied to the clipboard.
Update Notification
Auto-updates are opt-in and run only in packaged builds. Turn them on in Settings. When a newer release exists, the app downloads it in the background and shows a card at the top right of the main window: “Version X is available. Downloading in the background…” with a View Release Notes link. Once the download finishes the card reads “Version X has been downloaded and will be installed on restart.” with a Restart to Update button. A system notification also appears for both events.
The update channel (stable or nightly) comes from the updateChannel setting.
Other Windows
Workflow Execution Window
A frameless, transparent, always-on-top window that loads the workflow as an app (apps/index.html?workflow_id=...). It opens when you run a workflow from a global workflow shortcut and the workflow’s run mode is not headless. Headless workflows run without a window and write the last output to the clipboard.
Mini-App Window
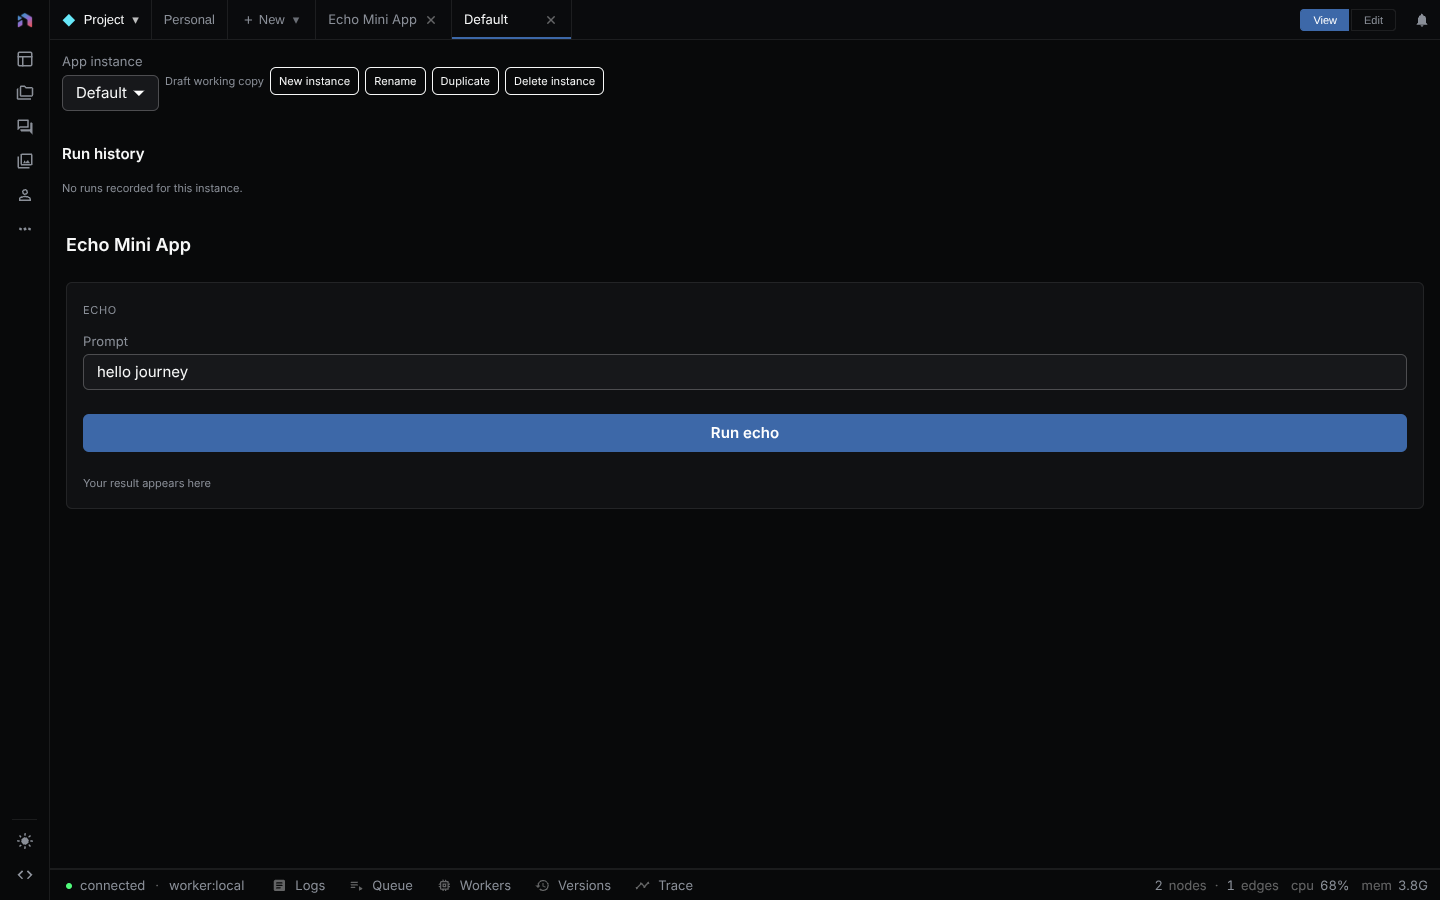
A standard window for one workflow’s mini app, opened from Mini Apps in the tray. It is 80% of the primary display up to 1200×900, with a minimum of 800×600, and the title is “
Chat Window
Standalone chat opened from the tray or Tools → Chat. It uses the /standalone-chat route with the same size rules as the mini-app window. Only one chat window exists at a time. Opening it again focuses the existing one. Same content as the Chats panel.
Performance Monitor
A small window (700×420) opened from Tools → Performance Monitor. It shows a table of process metrics.
System Tray
The tray icon stays running while NodeTool is active. Click or right-click it to open the menu.
From the top, the menu has:
| Item | What it does |
|---|---|
| Status line | “NodeTool: Running on |
| Start Service / Stop Service | Start or stop the backend. Each is enabled only when it applies |
| Show NodeTool | Bring up the main window, or recreate it if it was closed |
| Chat | Open the standalone chat window (needs a running backend) |
| Mini Apps | Submenu listing your workflows by name. Disabled when the backend is stopped or there are no workflows |
| Log Viewer | Open the Log Viewer window |
| Settings | Open Settings in the main window |
| Open Log File | Open the raw log file in the OS file handler |
| On Close Behavior | Radio list: Ask Every Time, Quit Application, Keep Running in Background |
| Quit NodeTool | Stop the backend and exit |
On Windows, double-clicking the icon also shows the main window.
On Close Behavior stores the windowCloseAction setting (ask, quit, or background). With ask, closing the last window shows a dialog with Quit and Keep Running in Background and a Remember my choice checkbox.
Native Menu Bar
The main window has a native menu bar built in menu.ts.
On macOS the app menu (NodeTool) holds the standard About, Services, Hide, Hide Others, Unhide, and Quit items. Quit uses the platform default and has no explicit accelerator.
File
| Item | Shortcut | Action |
|---|---|---|
| Save | Ctrl/⌘ + S |
Save the active workflow |
| Settings | Open Settings in the main window | |
| New Workflow | Ctrl/⌘ + T |
Open a blank workflow in a new tab |
| Close Tab | Ctrl/⌘ + W |
Close the active editor tab |
Edit
| Item | Shortcut |
|---|---|
| Undo, Redo, Cut, Copy, Paste, Select All | Platform defaults |
| Duplicate | Ctrl/⌘ + D |
| Duplicate Vertical | Ctrl/⌘ + Shift + D |
| Group | Ctrl/⌘ + G |
| Align | none |
| Align with Spacing | Ctrl/⌘ + Shift + A |
View
| Item | Shortcut | Action |
|---|---|---|
| Reload | Platform default | Reload the window |
| Toggle Developer Tools | Platform default | Open or close DevTools |
| Fit View | Ctrl/⌘ + 0 |
Fit the graph to the viewport |
| Reset Browser Zoom, Browser Zoom In, Browser Zoom Out | Platform defaults | Zoom the whole page, not the canvas |
| Snap to Grid | Checkbox that mirrors the editor’s snap-to-grid setting | |
| Toggle Full Screen | Platform default | Enter or exit fullscreen |
DevTools only work in unpackaged (dev) builds, where Ctrl/⌘ + Shift + I also toggles them.
Tools
| Item | Action |
|---|---|
| Chat | Open the standalone chat window |
| Log Viewer | Open the Log Viewer window |
| Performance Monitor | Open the performance monitor window |
| Model Manager | Open the Model Manager tab |
| Package Manager | Open the Package Manager tab |
| Help | Open the Help dialog |
| Downloads | Open the model downloads dialog |
Vaults
A radio list of your vaults with the active one checked. Picking another vault restarts the backend against that vault’s database and reloads the main window. Manage Vaults… opens Settings.
Window / Help
Window offers the platform-standard Minimize. Help has Learn More (opens https://nodetool.ai), Keyboard Shortcuts (Ctrl/⌘ + /), and System Information. The System Information dialog lists app, Electron, Chrome, and Node.js versions, OS details, install, conda, data, and log paths, and Python and CUDA status, with a Copy to Clipboard button.
Opening a workflow execution window removes the application menu until the menu is rebuilt.
Where the Electron Code Lives
For contributors:
electron/src/main.ts— entry point, window lifecycle.electron/src/window.ts— main window.electron/src/workflowWindow.ts— workflow execution, mini-app, and chat windows.electron/src/tray.ts— tray icon and menu.electron/src/menu.ts— native menu bar.electron/src/components/— React components for the splash and update notices.electron/pages/— the Log Viewer page.electron/src/updater.ts— auto-update flow.electron/src/perfMonitor.ts— performance monitor window.
See the Electron developer guide for build and debugging tips.
Related Docs
- Installation — download and first-run
- Configuration — settings persisted per-user
- Troubleshooting — boot and install issues
- Deployment — self-hosted / cloud alternatives